- Product
Reading RM Compare Reports: A Practical, 5 Part Blog Series
If you have ever opened an RM Compare standard report, seen a lot of graphs and a reliability number, and thought “Is this good? What do I do now?”, this series is for you. Many users invest time and energy in running sessions, only to feel deflated when reliability looks lower than they hoped or when misfit graphs appear to suggest something has gone wrong. The aim of this series is to turn those moments of frustration into confident, informed decisions about how to run and improve your sessions.
Why Focus on “Session Health”?
RM Compare is built on adaptive comparative judgement, which uses many pairwise comparisons to estimate a shared scale of quality rather than traditional marks. The standard report offers three powerful lenses on what happened in your session: the rank order of items, judge misfit, and item misfit, along with reliability statistics that summarise how consistently the model can distinguish between pieces of work. Taken together, these allow you to judge the overall “health” of a session. It allows us to understand whether the story it tells about quality is strong enough for your purpose, and where you might want to refine design or practice next time.
Thinking in terms of health is more helpful than pass/fail. A session with moderate reliability can still provide valuable insight and rich professional discussion if you understand where judges differed and which items were complex. Equally, a high‑reliability session might still raise questions if, for example, a few judges did most of the work or certain items proved especially contentious. This series will show you how to go beyond a single headline number and read the full story your report is telling.
Who This Series Is For
This series is designed for everyday RM Compare users rather than psychometric specialists. It will be most relevant if you are for example
- A teacher or department lead running classroom or departmental ACJ sessions.
- A school or trust assessment lead using RM Compare for moderation or standard setting.
- A quality assurance or assessment professional using RM Compare as part of a wider assessment strategy.
- A researcher using RM Compare data and wanting a clearer practical sense of what the reports are saying.
The posts assume you know how to set up and run a session in RM Compare, but not that you are comfortable interpreting all the graphs and statistics. Where technical ideas are needed (for example, why a Rasch‑style model is used), they will be explained in plain language and linked directly to what you see on screen.
What the Series Will Cover
The series is organised around the three main elements of the standard report, followed by a design‑focused finale:
- Part 1 – Understanding RM Compare Reports: Building Assessment Health, Not Chasing a Magic Number
Introduces the idea of session health, explains what rank order, judge misfit, item misfit and reliability represent at a high level, and reframes reports as diagnostic tools rather than verdicts. - Part 2 – Reading the Rank Order: What Story Is Your Session Telling?
Shows you how to read the rank order graph, interpret parameter values and reliability, and decide whether the emerging story about quality is strong enough for your context. This includes guidance on what different reliability ranges usually mean in practice and how reliability grows as judgements accumulate. - Part 3 – Judge Misfit: Making Sense of Agreement and Difference
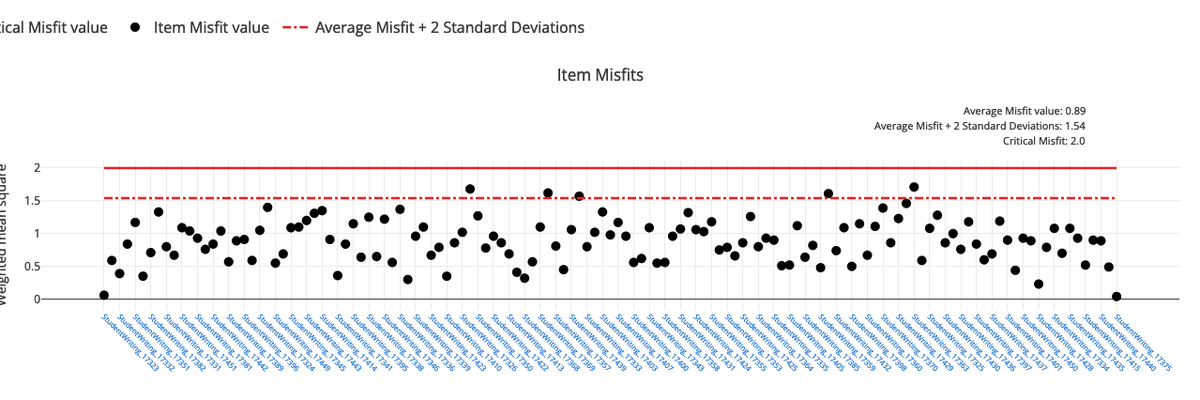
Explains what judge misfit actually measures, why some misfit is expected and often useful, and how to respond when a judge is flagged. You will see how to use misfit data to support calibration, professional dialogue and judge support, instead of reading it as a simple “good/bad” label. - Part 4 – Item Misfit: Listening to What the Work Is Telling You
Unpacks item misfit as feedback on both the work and the task. You will learn to spot items that are genuinely complex, ambiguous or boundary‑pushing, and how to use them to refine tasks, identify exemplars and deepen shared understanding of what good looks like. - Part 5 – Designing Healthy Sessions from the Start Brings everything together into practical design principles: choosing item numbers, recruiting and briefing judges, setting expectations for reliability, and using real‑time indicators to decide when to continue or stop. This part will also include a simple checklist you can use when planning future sessions.
Each part will include concrete examples, screenshots or sketches of key graphs, and “try this now” suggestions so you can apply the ideas immediately to your own reports.
How to Use the Series
You can dip into individual posts as needed, but there are two recommended routes:
- If you are relatively new to RM Compare reporting: Start at Part 1 and read in order. This will give you a coherent mental model before you zoom into judge and item misfit.
- If you are already running regular sessions: Scan Part 1 for the “session health” framing, then jump straight to the area where you feel least confident – often judge misfit or item misfit – before coming back to the design ideas in Part 5.
In all cases, the goal is not to turn you into a statistician. It is to help you look at a report and say, with confidence: “I understand what happened in this session, I know whether it is healthy enough for my purpose, and I know what I’d tweak next time.”