New - Learning Progress Dashboard (Experiment)
At RM Compare, we believe that the true value of Comparative Judgement isn't just found in the final rank order (the product), but in the cognitive journey students take to get there (the process). Today, we are excited to share an experimental piece of work: the Learning Progress Dashboard.
This browser-based diagnostic tool allows educators to look "under the bonnet" of a session to see exactly how learning evolves in real-time.
Learning Progress Dashboard
Try for yourself with some pre-populated data
The Problem: The "Black Box" of Assessment
Most assessment tools provide a snapshot which is a final grade or a static position on a leaderboard. What they often miss is the process of learning. When a student sits down to judge, they are doing more than just picking winners; they are calibrating their internal compass to a set of learning objectives.
Our experiment was simple: Could we use the raw data from all six of our primary data sources to tell the story of that calibration?
The 6-Point Learning Signature
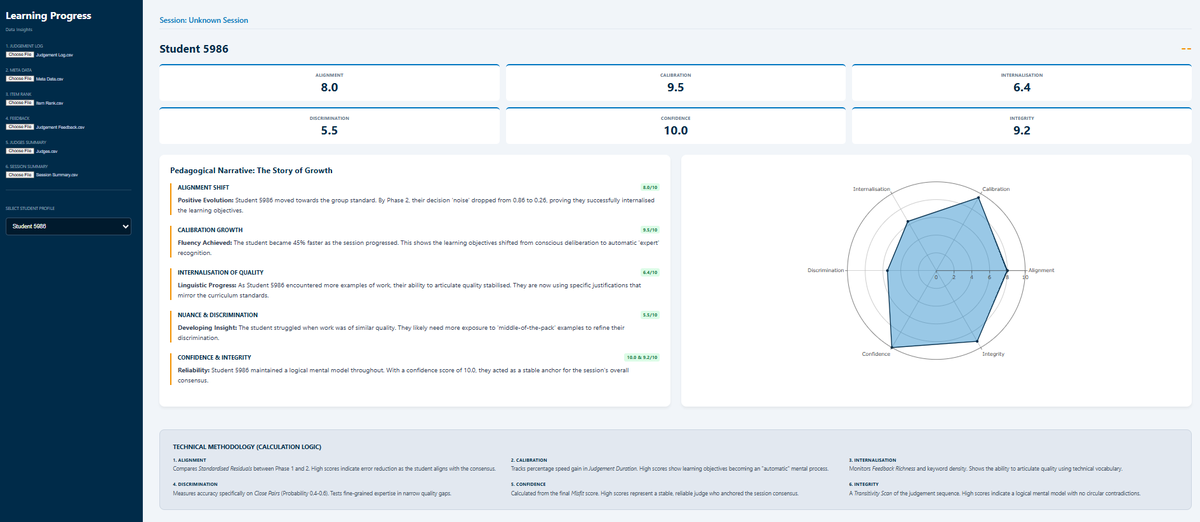
The dashboard surfaces a "Learning Signature" for every student, measuring progress across six distinct pedagogical dimensions:
- Alignment Shift: Are they narrowing the gap between their personal "gut feeling" and the group consensus?
- Calibration Growth: Is their cognitive load decreasing? We track the shift toward "expert fluency" as decision-making becomes more automatic.
- Internalisation of Quality: Are they beginning to "speak the language" of the curriculum through richer, criterion-based feedback?
- Discrimination Nuance: Can they tell the difference between two pieces of high-quality work that look nearly identical?
- Confidence Stability: Is their mental model robust enough to withstand the pressure of adaptive, "close-call" comparisons?
- Integrity: Is their logic consistent throughout the session, or are they falling into circular contradictions?
Progress Over Time: The "Phase" Analysis
The breakthrough in this dashboard is the Evolution Narrative. By splitting a session into two phases, the engine calculates the "Delta"—the specific change in student behavior from the first click to the last.
Instead of a score, teachers get a narrative:
"Student 6009 successfully internalised the learning objectives, reducing their standardised error from 0.60 to 0.31 while becoming 30% faster. This indicates a shift from conscious deliberation to automatic expert recognition."
Learning Progress Dashboard
Try for yourself - upload the demo data
You can find the Learner Progress Dashboard demo-data here ( Further details on the session can be found here.)
You can of course use your own sessions using the Data Extract functionality.
What’s Next?
This is an experiment, but it’s one that points toward a future where assessment is a diagnostic tool for growth, not just a measure of outcome. By surfacing the "how" and "why" of student choices, we empower teachers to have more meaningful, data-informed conversations with their learners.