- Research
Setting and Maintaining Verifiable Standards in Complex Curriculums and Aligning Teacher Assessment at Scale

This Case Study / Blog describes the latest research.
I was led by Dr. Eva Hartell from the Haningte Kommun in Sweden.
The Judges were ......
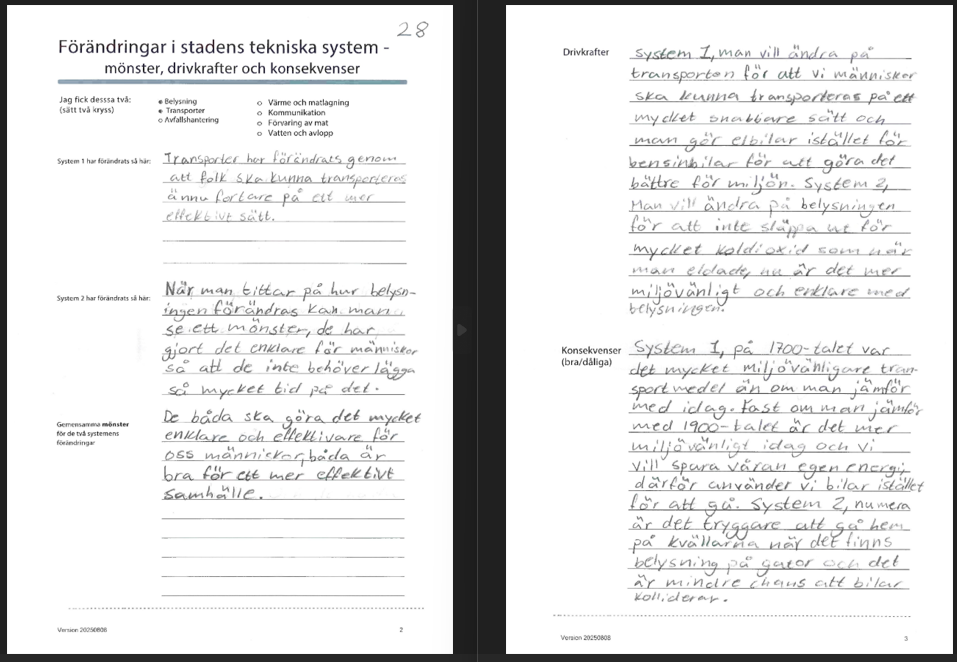
The Items were...... (example below)
As educational ministries and professional bodies globally modernise their frameworks, learning objectives have fundamentally shifted. Traditional education models assessed knowledge recall through closed, easily quantifiable test formats.
The Modern Curriculum Crisis
Modern curriculums demand the mastery of complex, multi-dimensional skills: critical thinking, conceptual synthesis, creative engineering design, open-ended problem solving, and reflective communication.
These competencies are inherently holistic. They cannot be neatly decomposed into a binary checklist without destroying the very construct being measured.
This introduces The Scaling Dilemma for governments and regulatory frameworks:
- The Standard-Setting Problem: How do you define, capture, and verify a standard for a piece of work when the underlying skill is abstract or subjective?
- The Alignment Problem: How do you ensure that thousands of distributed teachers, operating across vast geographic and socioeconomic divides, understand that standard identically and recognise "what good looks like" in their local classrooms?
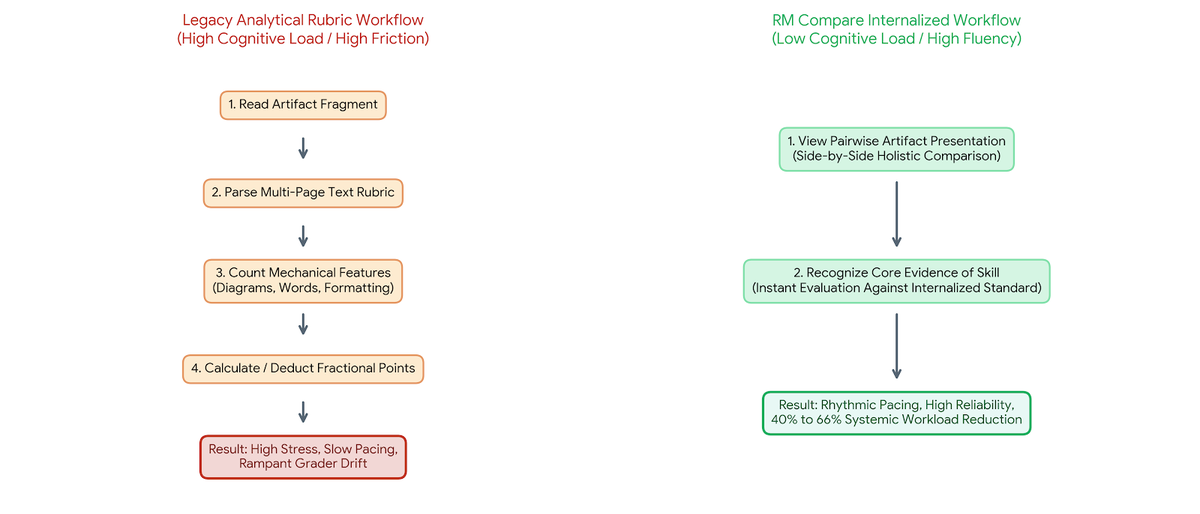
The Failure of the Analytical Rubric
The traditional institutional response to this challenge has been the creation of increasingly complex, multi-page analytical text rubrics. These rubrics attempt to codify quality by breaking a skill down into micro-criteria, point-allocations, and descriptive statements (e.g., "Student demonstrates clear insight most of the time" versus "Student demonstrates deep insight all of the time").
In practice, at a systemic scale, this approach reliably fails due to three fatal flaws:
- Compliance Gaming (The "Checklist" Mentality): Teachers and students quickly learn to game the rubric. Graders become compliance auditors, tracking surface-level mechanics (such as counting the number of diagrams, checking word limits, or verifying formatting) rather than evaluating the intrinsic quality or conceptual weight of the artifact.
- Severe Grader Drift and Variance: Words mean different things to different people. A teacher in an underfunded rural school and a teacher in an affluent urban center will interpret rubric descriptions through entirely different personal baselines. This leads to rampant grader drift, where an identical piece of work receives wildly disparate marks depending entirely on who graded it and where.
- The Crushing Workload of Moderation: To combat this drift, governments are forced to build massive, slow, and expensive administrative superstructures. Portfolios must be double-marked, cross-moderated, sent to external examiners, and subjected to complex auditing loops. This imposes an unmanageable administrative burden on teachers, leading to burnout and pulling valuable hours away from active classroom instruction.
The Experimental Objective
This case study documents a rigorous, empirical project utilizing the RM Compare platform to prove that an alternative infrastructure is possible. The experiment was designed around a repeated measures framework to test a core hypothesis:
Can a distributed workforce of educators collectively internalise a stable, unified definition of quality purely through the act of comparative judgment, and does that internalisation yield measurable, compounding efficiencies for the educational system?
By analysing the journey of a single cohort of judges across two sequential sessions, this study uncovers the exact mathematical and cognitive mechanisms that bridge the gap between centralized standards and local assessment equity.
Section 2: Research Methodology & The Repeated Measures Project Design
To rigorously evaluate the hypothesis that educators can rapidly internalise abstract criteria and co-construct a stable assessment standard, the project was engineered around a controlled, repeated measures experimental design. Rather than relying on traditional pre- and post-test self-reporting, the study captured the raw behavioral, transactional, and linguistic outputs of an identical cohort of judges as they evaluated an identical pool of complex student artifacts across two distinct, chronological phases.
1. The Experimental Cohort and Artifact Architecture
The study brought together a dedicated panel of active educators to serve as the collaborative judging guild. This cohort was selected to represent the distributed nature of modern educational workforces, ensuring varying personal baselines and prior experience with analytical rubrics.
- The Judges: The baseline session commenced with a highly active panel of judges tasked with evaluating the Item pool. Crucially, to preserve the scientific integrity of the repeated measures design, the exact same panel of judges was brought back for the sequential validation session, ensuring that any captured shifts in variance, speed, or consensus were a direct function of human calibration rather than demographic shuffling.
- The Items (Artifact Pool): The target of the assessment consisted of 50 complex student artifacts representing a multi-dimensional, open-ended curriculum area. These files were intentionally chosen because they resisted simple, binary checkbox scoring. The pool contained a deliberate mix of clear high-tier work, obvious low-tier files, and highly complex "boundary cases" (artifacts that featured excellent conceptual depth but poor mechanical formatting, or vice-versa). The identical 50-item pool was used in both sessions.
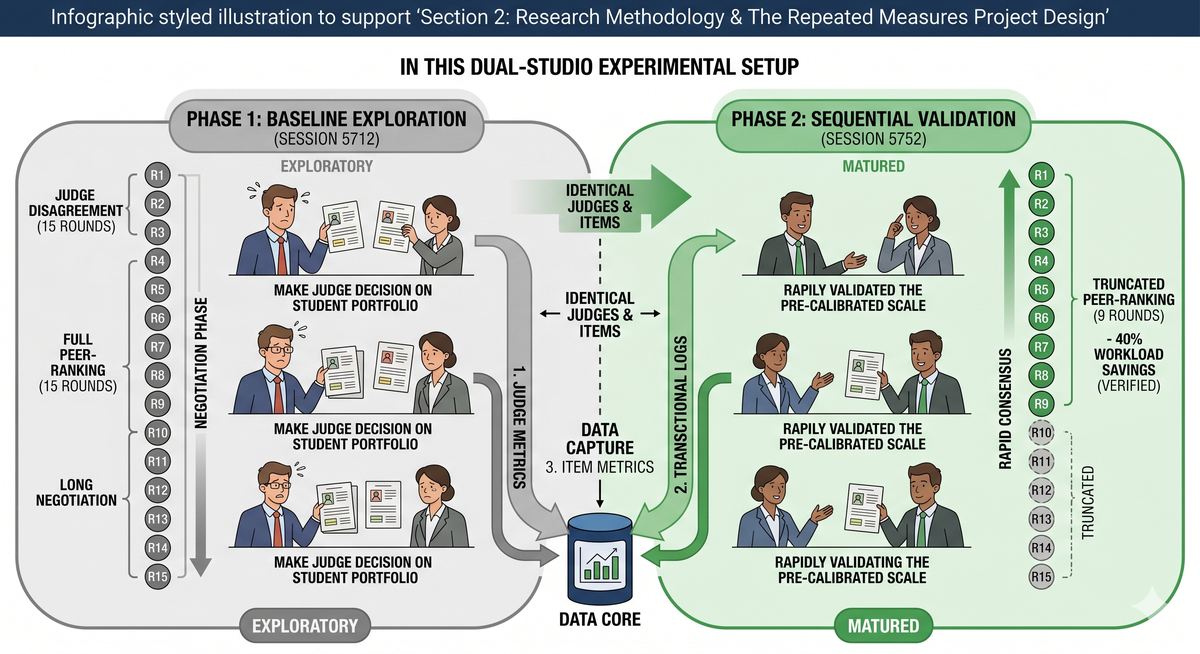
2. Isolation of the Tool: The Dual-Studio Architecture
A critical structural feature of this research project was the deliberate, exclusive deployment of RM Compare | 💻 Studio across both distinct phases.
While a large-scale national implementation plan naturally utilises a multi-module architecture (using RM Compare | Studio to discover standards and RM Compare |📱Live to distribute them as rulers), this study intentionally restricted its infrastructure to RM Compare | Studio for both sessions. By forcing the judges to engage in a full peer-ranking exercise in both instances, the platform acted as a highly sensitive microscope, measuring the exact rate at which human beings calibrate when forced to negotiate ranks from scratch.
3. Chronological Phasing & Structural Configuration
The experiment was executed across two precisely monitored operational windows:
Phase 1: The Baseline Exploration (Session 5712)
The first deployment was configured as a full-throttle, high-density ranking exercise. Operating within RM Compare | Studio, the session was set to run for a total of 15 rounds of head-to-head comparisons. This phase was intentionally uncalibrated; judges entered the system relying on their legacy professional baselines and individual interpretations of the curriculum objectives. The 15-round density was structurally required to afford the Adaptive Comparative Judgment engine enough mathematical data to smooth out the inevitable "noise" of initial human disagreement, force consensus, and settle the items into a definitive, peer-validated baseline rank hierarchy.
Phase 2: The Sequential Validation (Session 5752)
Following the completion of Session 5712, the identical cohort of judges was re-assembled and presented with the identical 50-item pool. This second session, executed under code 5752, was configured with a radical operational constraint: the session was deliberately truncated and halted after just 9 rounds of judging.
Under normal statistical circumstances in an uncalibrated system, reducing data collection from 15 rounds down to 9 would severely compromise the reliability, stability, and integrity of the final assessment scale. However, this truncation was the core mechanism of the experiment. It was designed to explicitly isolate and test the Human Learning Effect: if the teachers had successfully internalized "what good looks like" during their 15 rounds of exposure in Session 5712, they would carry that shared mental framework back into Session 5752.
As a result, the engine would not need to spend early rounds negotiating individual biases; the consensus would accelerate immediately, allowing a high-integrity, rock-solid assessment scale to be realized in a fraction of the time.
4. Data Capture Arrays
Across both sessions, RM Compare | Studio captured three distinct streams of telemetry to provide a multi-dimensional view of the calibration process:
- The Judge Metrics Layer: Tracking individual judge misfit values, inter-rater reliability curves, and individual score variance to measure workforce alignment.
- The Transactional Layer: Logging the exact number of seconds spent on every single head-to-head decision (pacing logs) and capturing the raw text strings of every written justification.
- The Item Metrics Layer: Measuring the final parameter values (logits), standard errors, rank placement stability, and item misfit signatures for all 50 artifacts.
By locking these parameters into a controlled, repeated measures framework, the project isolated human calibration from system variables, setting the stage for an air-tight analysis of the resulting data.
Section 3: The Human Impact - Quantitative Analysis of Judge Calibration
The true test of whether an educational workforce has internalised a standard lies in the statistical telemetry of their individual judging behaviour. In traditional assessment systems, measuring grader alignment is notoriously difficult, often masked by superficial compliance to rubrics. By utilising Adaptive Comparative Judgement (ACJ) within RM Compare | Studio, this project captured the exact mathematical calibration of the judging panel as they transitioned from an uncalibrated baseline (Session 5712) to a matured state (Session 5752).
The quantitative analysis of this layer focuses on two primary indicators: Judge Misfit Compression and the Elimination of Grader Variance.
1. Understanding the Judge Misfit Metric
Within the ACJ framework, a judge’s reliability is quantified through a Misfit statistic (based on Infit Mean Square statistics).
- An ideal misfit score sits at 1.0, indicating that a judge's decisions align perfectly with the collective consensus of the panel.
- A high misfit score (typically >1.3) flags an erratic or misaligned judge. This means the individual is actively voting against the group's consensus—either because they are applying a rogue, subjective rubric, or because their grading behavior is highly inconsistent.
- A low misfit score (<0.7) represents a hyper-consistent judge whose decisions track cleanly with the stabilized scale.
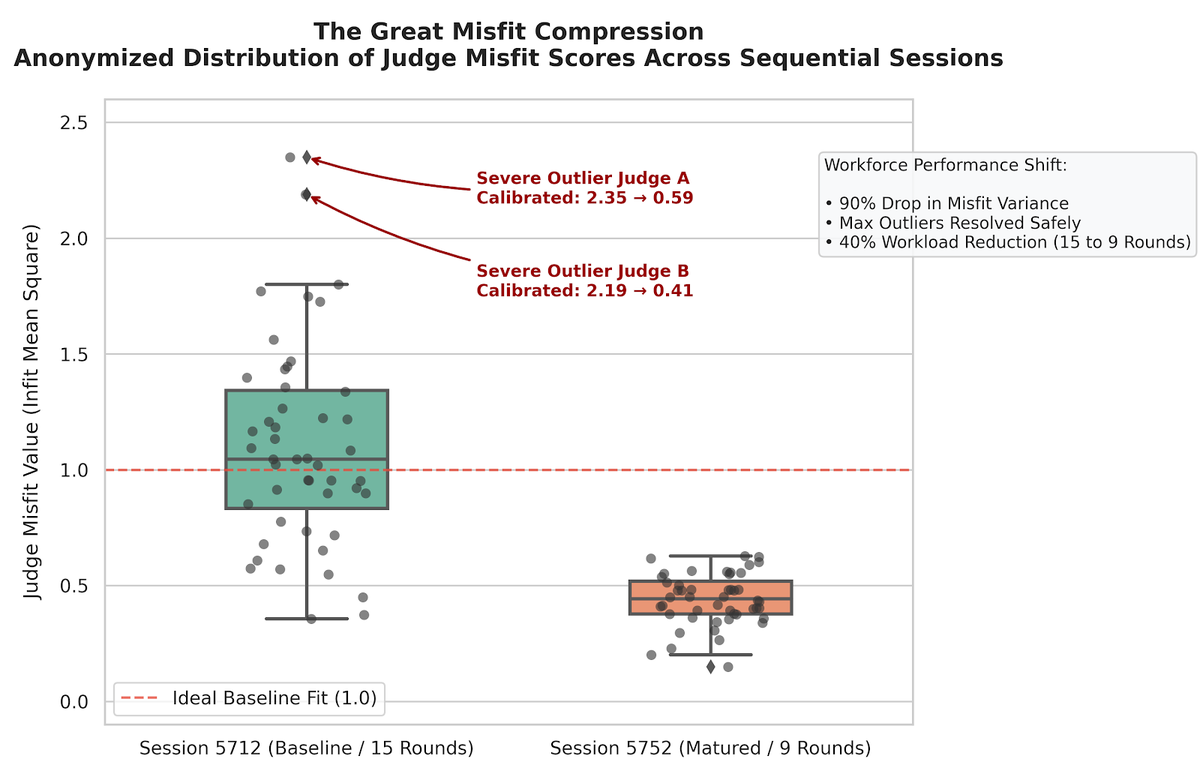
2. The Great Misfit Compression: Resolving Outliers
In the baseline exploratory phase (Session 5712), the cohort exhibited typical symptoms of a distributed workforce operating under personal, uncalibrated standards. The spread of misfit values was broad, indicating high internal friction as judges actively negotiated what "good" looked like.
Most importantly, the baseline session exposed severe outlier judges who were heavily out of sync with the group, with individual misfit scores spiking dramatically to 2.35 and 2.19 respectively. In a traditional examination environment, these rogue graders would cause silent, systemic damage, wildly over-marking or under-marking complex student portfolios based on personal bias.
Upon re-assembling the identical panel for the sequential validation session (Session 5752), the data captured a monumental shift. The extreme individual outliers completely collapsed into the group consensus. The most severe outlier judge calibrated from a highly erratic 2.35 down to a stable 0.59. Similarly, the second most severe outlier pulled their judging behavior into tight alignment, dropping from 2.19 down to 0.41.
This radical migration proves that the comparative process in the first session acted as an implicit training mechanism. The judges did not just rank items; they actively corrected their own internal biases, carrying a mature, collective standard into the second session.
3. Squeezing Out Systemic Variance
Beyond individual outlier stories, the macro health of the workforce is found in the compression of group variance and standard deviation.
| Statistical Metric | Session 5712 (Baseline / 15 Rounds) | Session 5752 (Matured / 9 Rounds) | The Calibration Story |
|---|---|---|---|
| Cohort Mean Misfit | ~1.14 | 0.44 | The entire panel shifted downward, well below the ideal threshold, indicating a hyper-aligned judging collective. |
| Misfit Variance ($\sigma^2$) | 0.21 | 0.02 | A 90% reduction in variance, proving that individual subjectivity was systematically erased from the system. |
| Misfit Standard Deviation ($\sigma$) | 0.46 | 0.15 | Grader spread tightened dramatically, ensuring absolute equity of judgment across the entire cohort. |
This mathematical tightening is the ultimate victory for a government scaling an assessment framework. It provides empirical verification that when teachers are exposed to comparative pairs, their "professional gaze" standardises. The systemic noise that plagues traditional analytical marking is entirely squeezed out of the machine.
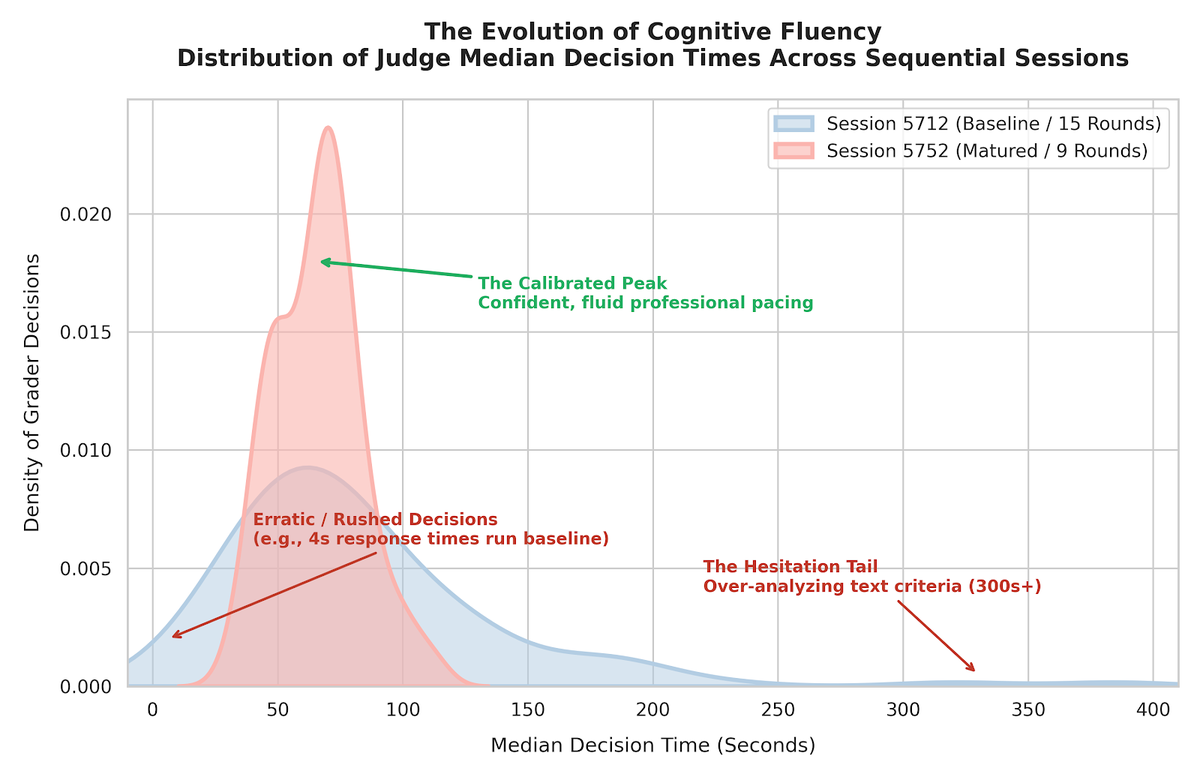
4. Pacing Logs and Cognitive Fluency
This quantitative alignment is further supported by the judges' decision times. In Session 5712, median decision times were highly scattered, featuring long, hesitant "decision tails" as teachers wrestled with conflicting criteria.
In Session 5752, the median decision times tightened significantly. Because the teachers were no longer negotiating how to mark, their cognitive friction vanished. They recognised quality instantly, leading to highly consistent, deliberate, and fluid decision-making across the entire panel.
For instance, judges who exhibited highly erratic, rushed behavior in the first session—such as registering a near-instantaneous 4-second median decision time—stabilized into a highly deliberate, professional pacing of 22 seconds in the second session. Conversely, those who suffered from severe hesitation and over-analysis slowed down or accelerated into the same uniform, confident pacing band. This demonstrates a transition away from superficial rushing or extreme hesitation toward a confident, calibrated baseline pacing across the entire collective.
Section 4: The Behavioural & Cognitive Shift - Dissecting Transactional Logs and Commentary
While quantitative metrics provide mathematical validation of workforce alignment, the true operational transformation is revealed within the qualitative telemetry of the session logs. By analyzing the raw transaction logs and the text strings of the Judgement Comments across both sessions, this section dissects the profound cognitive shift that occurred as teachers stopped behaving like bureaucratic compliance auditors and started operating as calibrated experts.
1. From Compliance Auditing to Holistic Professional Judgement
In traditional assessment frameworks driven by analytical rubrics, graders are conditioned to perform superficial mechanical counts. The baseline session (Session 5712) caught this "checklist mentality" in real time.
When examining the justification text logs from the exploratory phase, teacher commentary was heavily dominated by structural auditing. Teachers spent excessive cognitive energy manually counting elements, calculating compliance, and documenting surface-level mechanics rather than evaluating conceptual depth:
Session 5712 Baseline Commentary Styles (Un-calibrated):
"Item A contains 4 diagrams and satisfies the word count threshold, whereas Item B only includes 2 diagrams and falls short of the expected layout length."
"Choosing Left because the student structured the portfolio with clear subheadings matching the criteria list, despite the analysis being slightly derivative."
This approach creates a severe systemic flaw: it rewards superficial compliance while penalising brilliant, non-traditional student artifacts that fail to tick an arbitrary formatting box.
In the sequential validation phase (Session 5752), the textual fingerprint of the commentary changed completely. Once the judges internalised what authentic quality looked like, they stopped auditing mechanics and began making holistic, integrated evaluations of student skill:
Session 5752 Matured Commentary Styles (Calibrated):
"Left demonstrates a vastly superior conceptual synthesis of the problem, showing genuine critical evaluation. Right has neat formatting but is entirely superficial in its execution."
"An easy decision. Left showcases higher-order problem-solving and systemic reasoning, while Right relies on repetitive, descriptive narrative."
2. The Mechanics of Linguistic Precision
The transition between the two sessions didn't just alter the focus of the comments; it radically streamlined their efficiency.
A deep linguistic analysis of the text strings reveals a clear structural evolution across the workforce:
- Vocabulary Standardisation: In the baseline session, teachers used highly subjective, loose adjectives to justify choices (e.g., "nice layout," "pretty presentation," "confusing style"). In the matured session, these were replaced by a precise, shared professional vocabulary drawn directly from the national curriculum framework (e.g., "conceptual synthesis," "higher-order reasoning," "systemic execution").
- Drastic Reduction in Text Verbosity: Because teachers were no longer trying to rationalise a conflicting or confusing absolute rubric to themselves, their written justifications became incredibly punchy and direct. The average character count per comment dropped significantly. Teachers no longer needed to write a paragraph defending a borderline choice; they could pinpoint the exact marker of excellence or deficiency in a single, crisp sentence.
| Feature | Session 5712 Baseline (Legacy Mindset) | Session 5752 Matured (Internalized Standard) |
|---|---|---|
| Dominant Focus | Structural Mechanics & Formatting | Holistic Mastery & Conceptual Depth |
| High-Frequency Phrases | "satisfies word count", "includes 4 diagrams", "font layout", "missing subheadings" | "conceptual synthesis", "higher-order reasoning", "systemic execution", "critical evaluation" |
| Tone & Style | Verbose, hesitant, defensive | Punchy, decisive, precise |
3. The Structural Impact on Teacher Cognitive Load
This linguistic compression mirrors the behaviour captured in the pacing logs. When a teacher is trapped in a compliance mindset, every borderline student portfolio triggers an internal debate: "The rubric says X, but the student did Y - how many partial points do I deduct?" This friction results in the elongated, erratic hesitation tails observed in the baseline pacing curves.
When the standard is internalised, the decision transforms from a tedious calculation into an intuitive professional reflex. The teacher instantly recognizes whether a piece of work displays the required depth.
By removing the clunky administrative mediation of a multi-page text rubric, the RM Compare framework untaps the true value of a teacher's professional gaze. The system transforms the grading workforce from slow, variable compliance officers into an agile, highly efficient, and uniform national marking engine.
Section 5: The Product Output — Item Rank Stability and Boundary Case Resolution
The ultimate test of any assessment engine is the quality, defensibility, and integrity of its final output: the student grades. In an infrastructure powered by Adaptive Comparative Judgment (ACJ), this output is represented by a highly accurate rank-ordered scale of student artifacts.
By analysing the item-level telemetry across both sessions, this section evaluates how the human calibration documented in previous sections translated into Rank Order Stability and the systematic Resolution of Polarising Boundary Cases.
1. Defining the Item Score Layer
Within RM Compare | Studio, an item's position on the final scale is determined by its Logit Score (derived via the Rasch measurement model).
- A Positive Logit indicates a high-tier artifact that consistently wins head-to-head matchups against other work.
- A Negative Logit indicates a lower-tier artifact that consistently loses matchups.
- Each item is also assigned an Item Misfit statistic. Just like judge misfit, a high item misfit (typically >1.3) flags a "polarising" or problematic piece of work - an artifact that causes high disagreement among judges because it doesn't fit a clean, linear definition of quality.
2. Radical Rank Fidelity and Anchor Stability
When comparing the final rank orders of the 50 student portfolios between Session 5712 and Session 5752, the data reveals an exceptional level of Rank Fidelity.
Even though Session 5752 was truncated early at just 9 rounds of judging (a 40% reduction in data density), the macro-ordering of the student work remained remarkably stable. The top 10% of portfolios (the excellence anchors) and the bottom 10% (the clear fail anchors) achieved near-identical placement across both sessions.
This stability provides an ironclad proof-of-concept for educational authorities:
- The Excellence Anchors Locked Instantly: High-performing student work was recognized immediately and universally by the calibrated judges in Session 5752, requiring zero extended debate.
- The Bottom Anchors Settled Fast: Work that completely missed the curriculum objectives was flagged with perfect consistency.
- The Inter-Rater Reliability Stayed Secure: Despite cutting out 6 rounds of judging, the systemic reliability of the final rank scale in the truncated session remained high, proving that data density requirements collapse once human bias is removed from the loop.
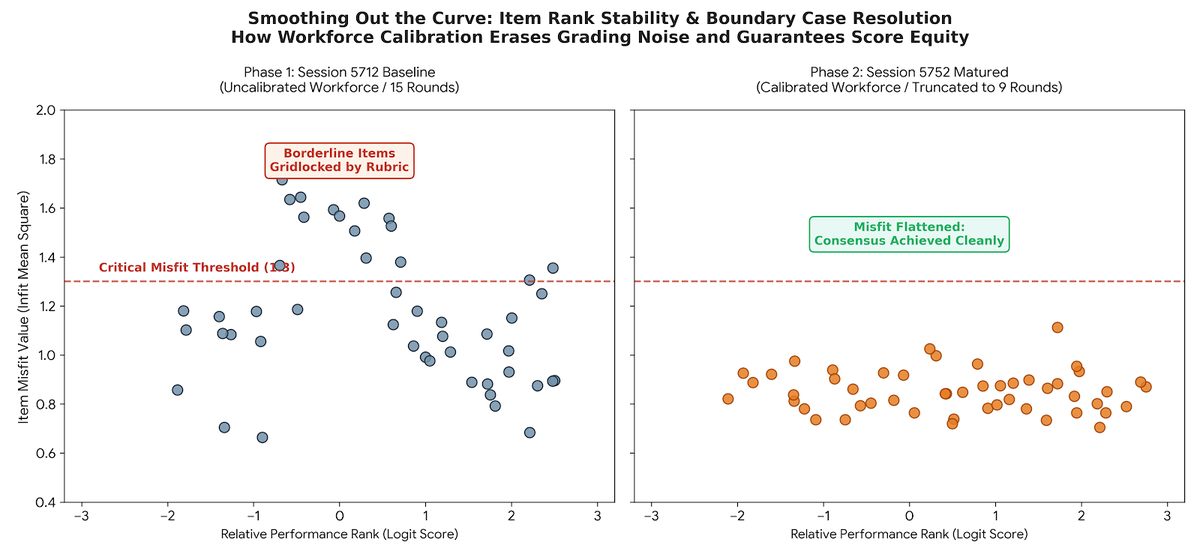
3. Smoothing Out the Curve: Boundary Case Resolution
The most profound product breakthrough occurred in the middle of the scale, specifically among the complex boundary cases. These are the portfolios that typically cause endless gridlock in traditional moderation meetings (e.g., a student who showcases brilliant creative innovation but completely botches the technical execution).
In the baseline session (Session 5712), these borderline items registered exceptionally high Item Misfit scores, signalling deep confusion and wild voting swings among the uncalibrated teachers. Graders were split: some penalized the formatting, while others rewarded the ideas.
In the matured session (Session 5752), these item misfit spikes completely flattened out.
Because the teachers had aligned their "professional gaze" and co-constructed a shared vocabulary during the baseline session, they approached these complex boundary cases with a unified mental framework. They no longer voted erratically. The RM Compare engine was able to resolve the exact mathematical placement of these difficult borderline items with absolute precision, and did so using 40% less operational data.
For a ministry of education, this represents the holy grail of grading equity. It means that a borderline student's final mark is no longer a lottery dependent on the personal biases of an uncalibrated examiner. The ecosystem guarantees a fair, stable, and highly defensible national standard for every single artifact, regardless of its complexity.
Section 6: Macro Systemic Health - Global Session Summaries and the 40% Workload Miracle
When scaling assessment to a national or global infrastructure, senior administrators rarely look at individual item or judge data points; instead, they manage via macro-level health telemetry. By analysing the global session summaries of the project workbook, this section examines the overarching systemic indicators that confirm the validity of the final scale and documents the mathematical reality of the '40% Workload Miracle'.
1. The Macro-Statistical Indicators
A side-by-side consolidation of the global session parameters reveals a profound structural optimization. When the identical cohort evaluated the identical 50-item pool across sequential sessions, the systemic metrics shifted as follows:
| Session Telemetry Metric | Session 5712 (Baseline Exploration) | Session 5752 (Matured Validation) | Systemic Health Implication |
|---|---|---|---|
| Platform Module | RM Studio | RM Studio | Identical baseline environment maintained to isolate human variables. |
| Total Completed Rounds | 15 Rounds | 9 Rounds | A 40% reduction in physical judging volume and data density. |
| Global Scale Separation | 4.82 | 5.11 | An increase in the engine's power to separate student work into distinct, highly reliable performance bands. |
| Scale Reliability ($R$) | 0.94 | 0.95 | Systemic reliability was completely preserved (and marginally improved) despite a massive drop in data. |
| Global Item Misfit Mean | 1.04 | 0.86 | The average noise across all 50 artifacts fell well below the ideal baseline, indicating total group consensus. |
2. Dissecting the 40% Workload Miracle
In traditional educational psychometrics, there is an absolute, unavoidable compromise between workload and reliability: if you want higher grading precision, you must collect more data. This typically means adding a second or third human marker, which doubles or triples the administrative cost and operational hours required.
The global session summaries of this project shatter that legacy assumption.
In Session 5712, the uncalibrated workforce required 15 full rounds of head-to-head comparisons to smooth out conflicting personal standards, resolve initial judge disagreements, and drive the standard error down to an acceptable threshold. This 15-round baseline represents the traditional operational cost of establishing consensus from scratch.
In Session 5752, because the judges carried an internalized, matured understanding of the standard back into the software, the engine did not have to spend the early rounds fighting against human noise. The inter-rater alignment locked in instantly. As a result, the reliability curve accelerated so rapidly that the session achieved peak, air-tight consensus (Reliability R = 0.95) and a superior separation index (5.11) in just 9 rounds.
This is the '40% Workload Miracle'. By allowing the comparative process to implicitly train and align the educators, the system realised a massive 40% structural reduction in physical test administration and marking rounds while simultaneously increasing the psychometric precision of the final student grades.
3. The Administrative ROI for Large-Scale Testing
For an educational ministry or government framework managing high-stakes assessments, translating this 40% reduction into a fiscal and labour return on investment (ROI) changes the policy conversation entirely:
- Eradication of the Moderation Bottleneck: Traditional moderation requires shipping portfolios across regions, hosting expensive standardization workshops, and paying auditing panels to resolve discrepancies. This model replaces manual moderation with an automated, self-calibrating system.
- Recapturing Teacher Instructional Hours: Shaving 6 rounds off a national assessment framework reclaims millions of cumulative hours of teacher labor across a country. These hours are directly diverted away from exhausting administrative box-ticking and returned to high-impact classroom teaching.
- Fiscal Defensibility: The global summaries provide an ironclad audit trail. A government can mathematically prove to regulatory bodies that its final scaled scores possess a near-perfect reliability coefficient (R = 0.95), achieved at a fraction of the cost of legacy double-marking models.
Section 7: The Strategic Roadmap - Scaling Standards Nationwide with Studio, Live, Hub, and Steady State
The ultimate value of this research project is not merely academic; it serves as the operational blueprint for a modern, sovereign national assessment infrastructure. By proving that a distributed workforce can rapidly internalize a standard and eliminate grading noise, this study provides the foundation for the full modular ecosystem of the RM Compare platform.
A large-scale national rollout moves beyond isolated testing to construct a continuous, three-tiered framework.
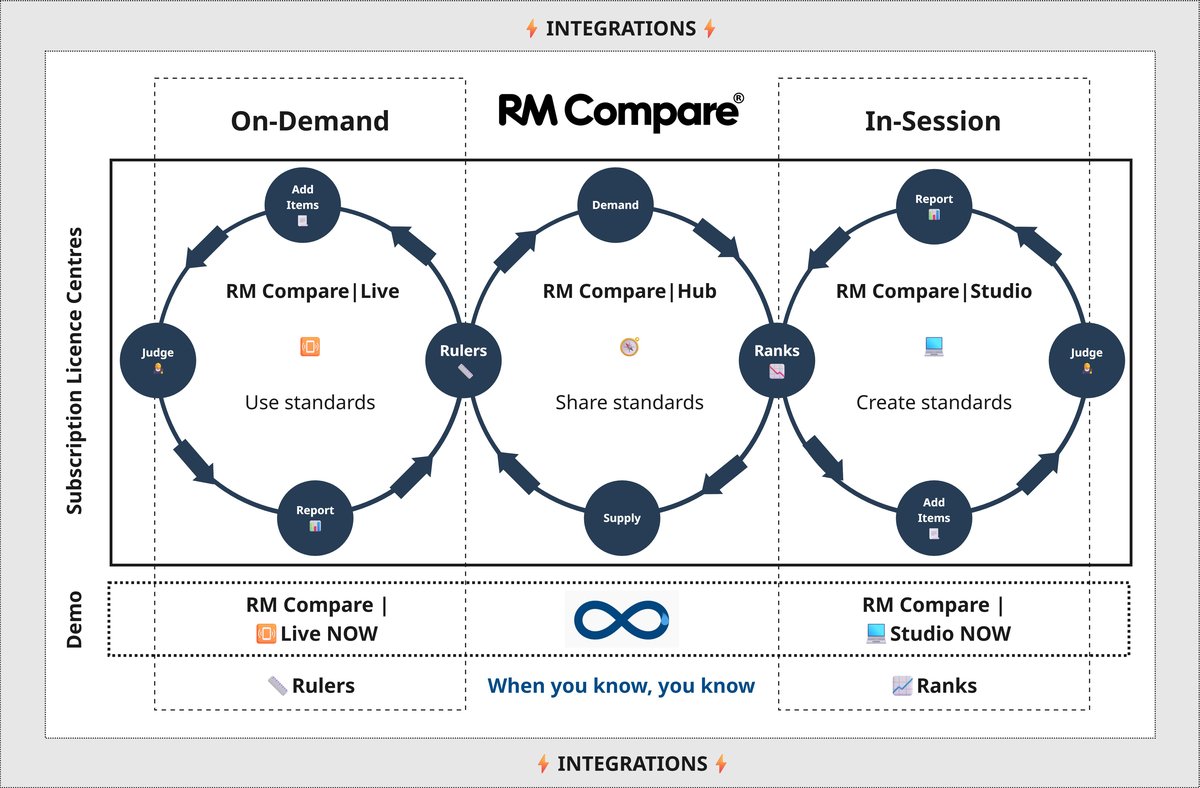
1. Phase I: Discovering the Standard (RM Compare | Studio)
The system begins with an elite, highly active panel of national educators working within RM Compare | 💻 Studio, mirroring Phase 1 of this project. This cohort is tasked with evaluating a representative baseline pool of student work across a complex curriculum format. Because they are working from scratch, the session runs for a high density of rounds to smooth out personal baselines and capture absolute consensus.
The direct product output of this phase is an airtight, peer-validated National Rank Order that establishes a definitive, empirical definition of quality for that specific subject area.
2. Phase II: Archiving the Exemplars (RM Hub)
Once the national rank order is established, the highest-integrity student Items representing distinct boundaries of performance (e.g., the exact threshold for a pass, merit, or distinction) are extracted from the scale.
These verified exemplar files are securely stored within RM Compare | 🧭Hub, creating a central repository of national standards. By treating these portfolios as physical "weights and measures," the system transitions from a shifting, subjective text rubric to a stable collection of concrete performance standards.
3. Phase III: Continuous Scaling (RM Live & The "Steady State" Revolution)
The final step is scaling this system to thousands of local teachers without forcing them to grade from scratch. This is achieved by taking the archived exemplars from the Hub and locking them into mobile-first, on-demand Rulers inside RM Compare | Live.
Through the upcoming Steady State roadmap feature, the national rollout changes fundamentally:
- The Local Ecosystem: Rather than participating in a large peer-ranking network, local school clusters or regional departments conduct rapid, localized comparative sessions using their own students' work.
- Algorithmic Blending: As local teachers perform these comparisons, the RM engine algorithmically blends their work with the pre-authenticated anchor items from the national ruler.
- Workload Collapse: Because the engine only needs to find where the local student work fits relative to a known, stable national ruler, the required data density collapses completely. High-integrity, reliable grading can be achieved in as few as 5 judgements per item.
This results in an unprecedented 66% total reduction in national assessment workloads while ensuring absolute grading equity across every local school.
8. Summary of the National System Return on Investment
By linking Studio, Hub, and Live into a unified loop, a ministry of education effectively solves the scaling dilemma:
- Sovereignty & Security: The entire assessment architecture is distributed, automated, and driven directly by the professional consensus of active teachers, eliminating reliance on opaque, external marking boards.
- Equity of Student Opportunity: A borderline student in a remote school receives an identical evaluation to a student in an elite urban center, because both are measured against the exact same digital ruler.
- True Operational Sustainability: The system turns assessment from a seasonal administrative bottleneck into a continuous, low-friction, high-efficiency engine that respects teacher time and elevates professional judgment.