- Product
Transforming 'True Scores' to scaled scores to facilitate grading
The principles of generating a linear scale from the parameter values to enable the application of values / grades
What's the challenge here?
RM Compare admins will be familiar with this rank order report. Perhaps the most common question we receive is how to use the data within to apply grades and / or values. This article explains some of the challenges, our current approach, and how you can try it for yourself.

How can we convert true scores to scaled scores?
To understand this process, you must appreciate how values are calculated and the units in which they are reported.
The core of the ACJ system is the parameter value ('true scores'). The output of the complex calculation / estimation process are parameter values - one per item. To create a rank, we just "sort" the parameter values in descending order. You could use these ordinal numbers to give you a crude "score" value, but there's a lot more information here.
The parameter value in expressed in a unit called the "logit". This is a just a convention meaning that the numbers are the log of the odds of the estimated chance of an item "winning" a comparison. It's a convenient unit as it makes the calculation of specific odds between 2 items trivial. All you have to do is looks at the difference between 2 parameter values to get the odds, the probability that one will win over the other.
Ideally our score should capture the relative differences between values and an analogue of quality. So the raw parameter value is on a logarithmic scale (the natural logs). In theory it can range from positive to negative infinity. In practice it's effectively bounded between plus and minus 10. (Values that are slightly higher or lower are possible but not common)
We don't want the range of our scores to be open ended. We will have a fairly clear concept of the maximum score (100%) and an agreed definition of a minimum score (zero, 1, DNF...). Also, the score is likely to be considered more on a linear scale (e.g., anyone scoring 80% has performed twice as well as someone only scoring 40%).
Given these requirements, our first pass at creating a score is to take the parameter values and squash them into a fixed range. We can just use a sigmoid function for this and in our case the logistic function makes most sense (1 divided by 1 plus e to the power of negative x - x = parameter value). This "translates" our parameter values into a range from 0 to 1. Once we have this fixed range, we can then scale it to any values we like.
You can anticipate that the actual scaling and translating process will be very context specific, so, at this stage we're arbitrarily setting it to range from 1 to 100 (it is possible to change this to an alternate scale as required).
How can I try this for myself?
We have added a new column ('Params as a score') to the Item download file available in the reports area. This takes the principles outlined above to auto generate the linear values. This in turn allows the user to set their own scales and apply grade boundaries.
Anything else I should be thinking about here?
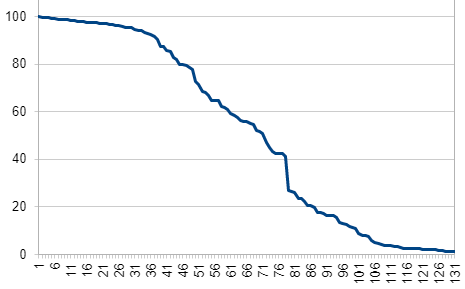
While we are excited about the potential that the principles outlined here offer, we recognise that there some learnings still need to take place. For example, the 'quality' of the linear data is dependent on the session data itself (see below). We can see in the examples below how different the graphs look as the session progresses.
Linear data taken from round 16 of an RM Compare session with 132 scripts (Reliability: 0.88 +/- 0.02)

Linear data taken from round 8 of an RM Compare session with 132 scripts (Reliability: 0.83 +/- 0.09)
Please contact us if you would like more information.