- Product
Standard reporting
Learn how to interpret and understand your data, and how get the most out of it.
Drive impact
We know that RM Compare can provide you with great insight into your student’s ability. We also know that the reports can be quite difficult to interpret. If you’re struggling to understand what your reports are saying this article should help.
👉 How to use: Select your role and setting above. The generator will build a custom prompt that directs the AI to search the entire RM Compare Product Portal.
Standard Reporting StepThru
View, download, print and share our brilliant, illustrated guide
The Rank Order
This graph shows you how the judges have ranked the work. The highest rated work is on the left and the least good is to the right. You can view each piece of work by clicking on the file name at the bottom of the chart.
The steepness of the line between items tells you the difference in quality. A steep line indicates there is more of a difference in quality, whereas a shallower line indicates that the work has a smaller relative difference.
Reliability
In basic terms, good reliability means that if you ran the session again, you would be likely to get similar results.
Reliability is shown as a number between 0 and 1. The closer to 1, the higher the reliability.
RM Compare, and Adaptive Comparative Judgement, can give higher levels of reliability in a shorter time than traditional methods of moderation and standardisation.
Judge data
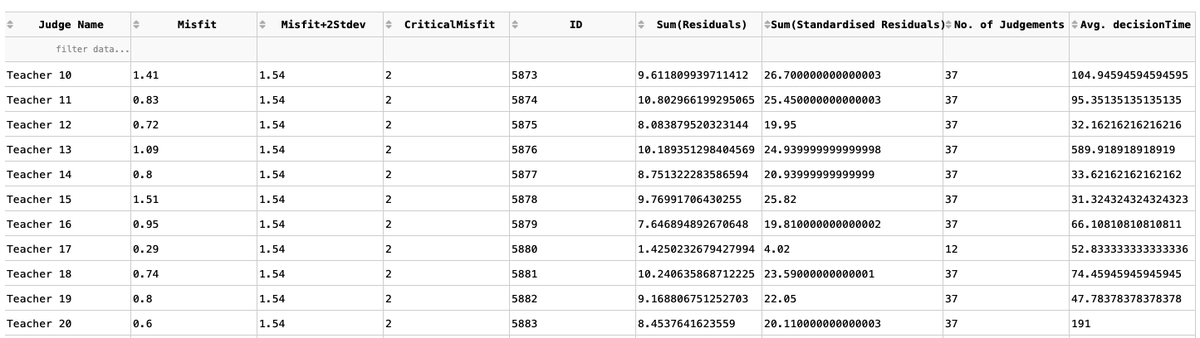
This table contains a lot of data about a session. Our research partners love this level of detail - lot's of our other users less so! If you do take the time to dig in you can be rewarded with even greater insight.
The No. of judgements column shows how many judgements each judge made. The average decision time column shows you the average amount of time it took each judge to make their judgement.
RM Compare works best when judges go with their instinct, so it’s worth looking at any judges that have taken a lot longer than others. At the same time, very short decision times can indicate that judges are randomly choosing which piece of work was best.
Both of these pieces of information can have an impact on your reliability, so if it’s lower than you’d like, it’s worth looking at these numbers.
Judge Misfits
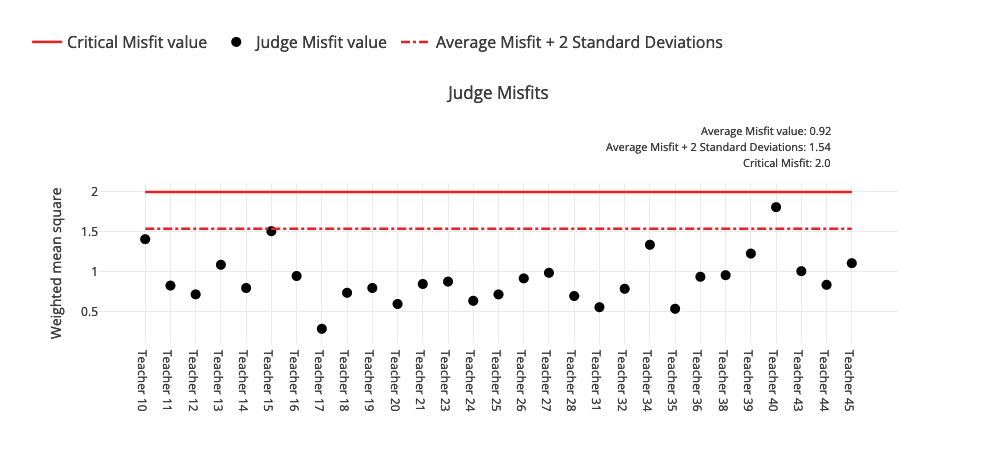
This section shows you how aligned the judges were on their decisions. Judges whose dots appear above the solid red line are those who consistently saw things differently to everyone else (note - think of this as noise not bias. We are not saying an outlier is right or wrong, only that they are different).
The number of judge misfits is normally very low, but judges that appear above the red line can have an impact on your reliability. It can also be an indication that judges didn’t understand the task, or the holistic statement.
Item data
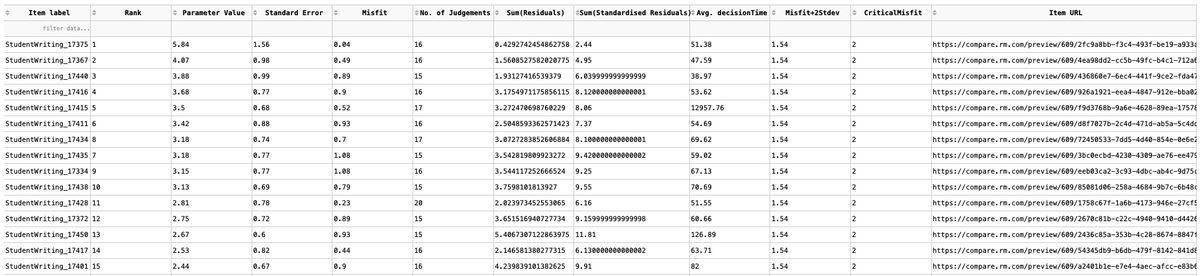
This table contains a lot of data about each piece of work that was judged. Like the judge data table, there is a lot of additional information here that may or may not be particularly useful to you. However, this table is useful for seeing the rank order, as well as how long it took each judge to make their decision. Also, if you scroll to the right, you’ll see the Item URL column. If you want to view the piece of work, simply copy this link and paste it into a new tab on your browser.
Item Misfits
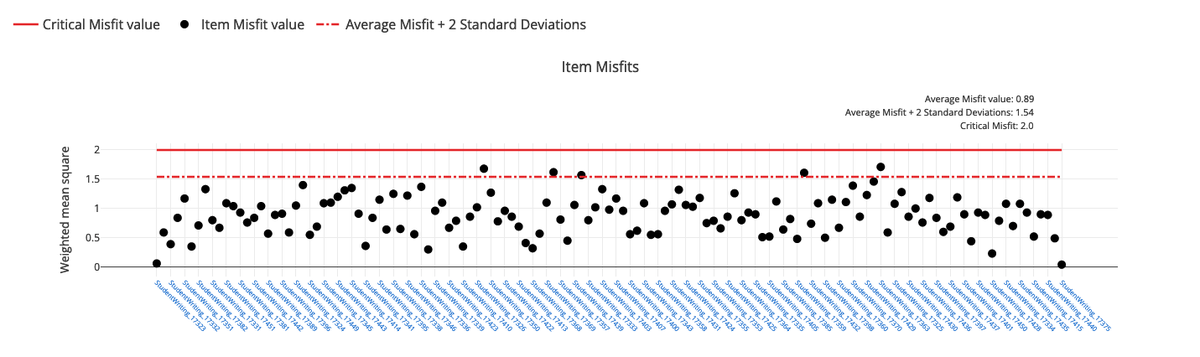
This is similar to the Judge Misfit graph. It shows you how aligned judges are on their judgement of each item. Each dot represents a piece of work. The dots that are above the solid red line are where judges found it more difficult to come to a consensus on its value. Basically, as a group, they found it hard to decide on the quality of the work. You may want to dig in to find out why this was the case.
Test your knowledge
Five quick questions to test your understanding
Can't find what you’re looking for?
Get in touch, we are here to help.
Related Articles
- FAQs
- Transforming 'True Scores' to scaled scores to facilitate grading
- Advanced reporting
- Premium Reporting
Related Questions
-
What is the Misfit report, and what does the Data mean?
Misfit data described the level of consensus in a session.
The Judge Misfit report shows non-consensual judges. These are judges who do not share the same view on Item value as other judges in the session. There may be many reasons for this and it might warrant further investigation.
The Item Misfit report shows non-consensual Items. These are Items that the judging pool did not share the same perception of value.
You can read more about reporting here. -
How does Feedback get distributed back to the Judges at the end of the Session?
If you are using RM Compare for Peer-to-Peer Assessment, the Contributing Judges (the students) can be given access to the Feedback submitted in relation to their Item from within the software - make sure you switch on the function that allows judges (students) to 'view reports' when setting up your session. If you are using RM Compare for Teacher-led Assessment, any Feedback left by Judges will be available to the Administrator in the Feedback Report. It can be Downloaded as a CSV file and distributed to the Judges via your preferred method.
You can read more about feedback in a recent blog post.