NEW! ⚡NOW LbE Reporting
The new ⚡|NOW reporting allows a user to view work from the standard that is of a similar standard to their own, as well as work that is of a quality that is a little higher and a little lower.

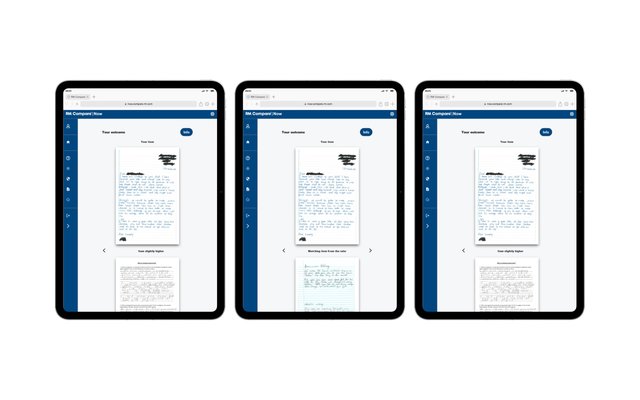
The new ⚡|NOW reporting allows a user to view work from the standard that is of a similar standard to their own, as well as work that is of a quality that is a little higher and a little lower.

Despite being only a few weeks since our last Newsletter, we have plenty to share in this update, the highlight being the extension of RM Compare | ⚡NOW onto non-mobile devices.

When you build a mobile experience for comparative judgement, the temptation is to start with the desktop application and ask: how can we fit everything onto a smaller screen? With RM Compare |⚡NOW, we asked a different question: what does someone need to make a useful comparison, right now?
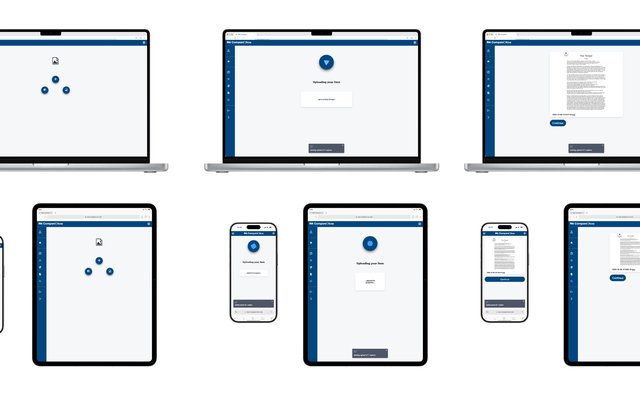
Hot on the heels of the 'mobile first' release of RM Compare | ⚡NOW. we are pleased to make it accessible on any* device.

In November 2025, Skills England released the UK Standard Skills Classification (UK‑SSC): a comprehensive mapping of 3,343 occupational skills, 4,926 knowledge concepts, 21,963 occupational tasks and 13 core skills, linked across occupations, qualifications and sectors.

Three years after the launch of ChatGPT, generative AI is reshaping assessment, but the picture is neither apocalyptic nor trivial. Students and teachers are using AI tools daily, and assessment providers like RM Assessment are working hard to turn this disruption into lasting improvement across fairness, speed, and insight.
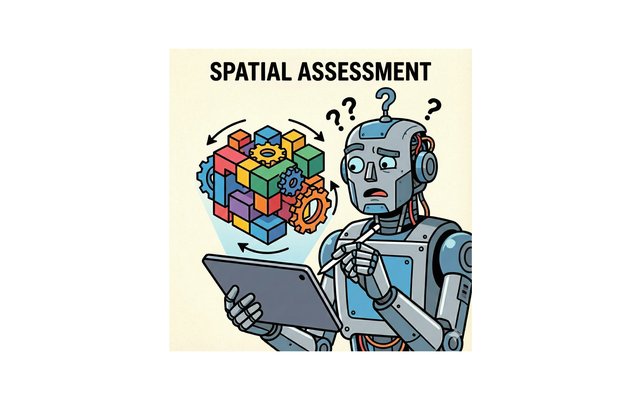
If you look at the current headlines in education, you’d be forgiven for thinking human intelligence is made entirely of words. We are currently locked in an arms race regarding "Text Intelligence." We worry about Large Language Models (LLMs) writing essays for students, and we counter by building AI tools to grade those essays. We are obsessed with the Linguistic Bottleneck - the idea that the only way to prove you understand the world is to write a description of it. But what if we are assessing the wrong intelligence entirely? What if the future of assessment isn't about better ways to read text, but better ways to see action?

The 2025 apprenticeship assessment reforms have shifted responsibility for quality assurance decisively toward training providers. With the launch of Skills England and new flexibility in assessment delivery, providers are no longer just preparing learners - they are increasingly validating them.
The best way to avoid the “we worked hard and reliability is low” moment is to design sessions so that health is baked in from the start. Healthy sessions are not accidents: they result from clear purpose, good task design, well‑briefed judges, and enough comparisons to let the model discover a shared scale of quality. This post turns what you now know about rank order, judge misfit and item misfit into concrete design principles you can apply before, during and after a session.
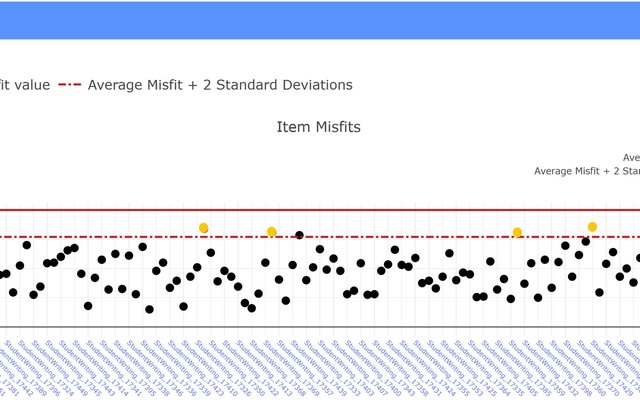
If judge misfit shows where people see things differently, item misfit shows where the work itself is provoking disagreement. In an RM Compare report, item misfit does not mean “bad work” or “faulty items.” It means, very specifically, “here are the pieces of work that your judging pool did not see in the same way.” Those items are often where your assessment task, your construct, and your judges’ thinking come most sharply into focus.
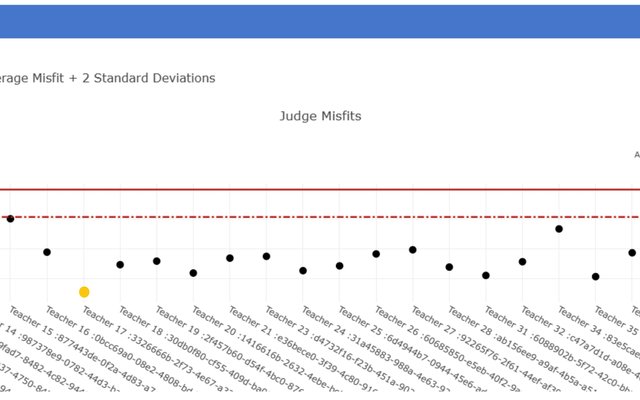
When users first encounter the judge misfit graph in an RM Compare report, the immediate worry is often: “Have my judges done it wrong?” The term “misfit,” red threshold lines, and dots floating above them can feel like an accusation. This post reframes judge misfit as a structured way of seeing where judges are not sharing the same view of value as everyone else, and therefore where the richest professional conversations and the most important quality checks can happen.

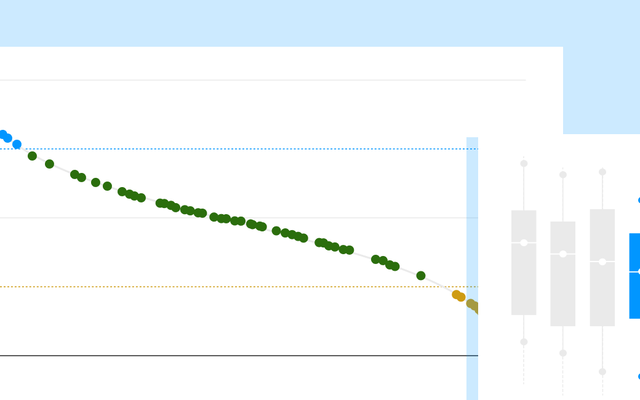
The rank order is the heart of an RM Compare report: it is the clearest expression of what your judges, working together, thought about the relative quality of the work. Understanding how to read it (beyond “who came first and last”) is the fastest way to move from staring at a graph to making confident decisions about your session’s health.

Most RM Compare users open a standard report, see a reliability value and a set of graphs, and then have to decide - often very quickly - whether their session “worked.” A single number is doing far too much heavy lifting in that moment. This first post reframes how to think about your reports. Instead of asking “Is my reliability high enough?”, the more useful question is “How healthy is this session, and what is it telling me to do next?”